Warning: Undefined array key 0 in /data/www/indicadors/wp-content/themes/gir_theme/template-parts/sections/pageTitle.php on line 19
Fields of study > Sensitive ecosystems
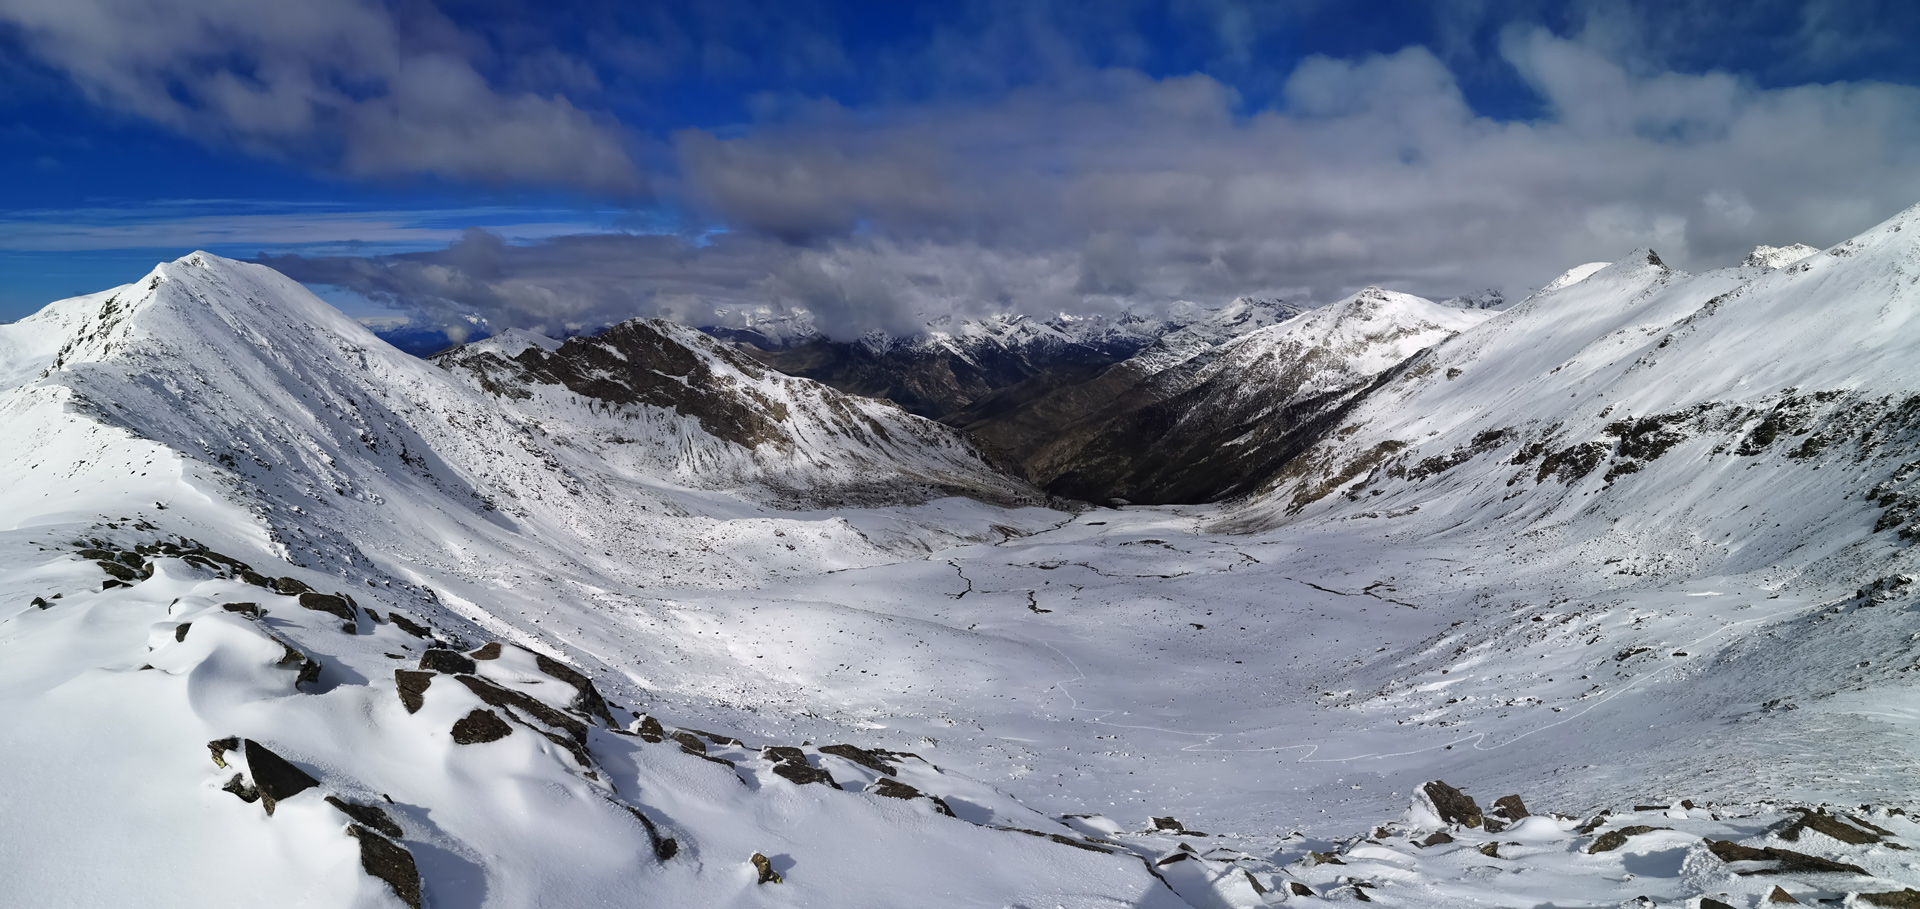
Glacier area
Since 1990, more than 30 glaciers spread across the different massifs of the Pyrenees are monitored. Specifically, based on different observation campaigns carried out in 1990, 2000, 2011 and 2020, the area (in hectares, ha) covered by these glaciers is monitored. This is the climate change indicator shown below.
Monitored massifs and glaciers are the following (the map shows the location of the massifs; it is recommended to enlarge the map for greater detail):
Balaitús massif – Glaciers: Las Neus, Pabat.
Gabietous massif – Glaciers: Taillon, Gabietous.
Infierno massif – Glaciers: Infierno, Infierno Oriental.
Maladeta massif – Glaciers: Aneto, Maladeta, Tempestades, Barrancs, Coronas.
Monte Perdido massif – Glaciers: Monte Perdido, Marboré, Pailla Este, Astazou, Pailla Oeste.
Munia massif – Glaciers: Munia, Barroude.
Perdiguero massif – Glaciers: Seil de la Baque, Boum, Gourgs Blancs, Portillón de Oô, Cabrioules, Maupas, Graouès.
Posets massif – Glaciers: Llardana, La Paúl, Posets.
Vignemale massif – Glaciers: Ossoue, Oulettes, Petit Vignemale, Clot de Hount, Montferrat.
The evolution for the period 1990-2020 of the glacier area (in ha) in the massifs with a larger glacier area in 1990 is shown (for each year of observation, the total value of each massif is the sum of the area of the glaciers belonging to the massif), and it is also shown the evolution for the same period of the area (in ha) of the glaciers with a larger area in 1990 (distributed into three groups: more than 20 ha in 1990, between 15 ha and 20 ha in 1990, between 10 ha and 15 in 1990).
Glacier area
Visualiza este indicador en detalle
Descárgate los datos
CSV Glacier area per massif - Pyrenees (1990-2020) Graph Glacier area per massif - Pyrenees (1990-2020)Descárgate los datos
CSV Glaciers with an area > 20 ha in 1990 Graph Glaciers with an area > 20 ha in 1990Descárgate los datos
CSV Glaciers with an area between 15 ha and 20 ha in 1990 Graph Glaciers with an area between 15 ha and 20 ha in 1990Descárgate los datos
CSV Glaciers with an area between 10 ha and 15 ha in 1990 Graph Glaciers with an area between 10 ha and 15 ha in 1990


Bulletin of Climate Change Indicators of the Pyrenees 2020
The Bulletin of Climate Change Indicators of the Pyrenees (BICCPIR) 2020 aims to deepen the knowledge of the anthropic climate change effects in the Pyrenees. Thus, information on the climate evolution is provided through a set of indicators grouped by systems.